Gráficos con pandas
Publicado el: 23 de Diciembre del 2020 - Jhonatan Montilla
En este artículo les enseñaremos como es posible obtener gráficos directamente desde la librería Pandas, por lo general la librería más utilizada para este fin es la de Matplotlib, sin embargo, Pandas también dispone de una serie de gráficos bastante interesantes.
Podrá descargar el conjunto de datos directamente a través del enlace a nuestro repositorio.
In [1]:
import pandas as pd
In [2]:
trend_data = pd.read_csv('search_trend_data.csv')
t_data = trend_data[-20:]
t_data = t_data.reset_index(drop=True)
In [3]:
t_data.head()
Out[3]:
| Week | eLearning | DataScience | MachineLearning | ArtificialIntelligence | DeepLearning | |
|---|---|---|---|---|---|---|
| 0 | 3/05/2020 | 86 | 31 | 41 | 22 | 15 |
| 1 | 10/05/2020 | 83 | 33 | 40 | 22 | 15 |
| 2 | 17/05/2020 | 66 | 33 | 40 | 21 | 15 |
| 3 | 24/05/2020 | 57 | 32 | 40 | 20 | 15 |
| 4 | 31/05/2020 | 65 | 33 | 41 | 21 | 14 |
Gráfico de Líneas
In [4]:
trend_data.plot();
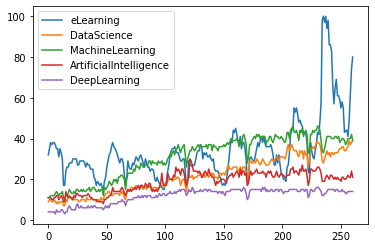
Gráfico de Barras
In [5]:
t_data.plot.bar();
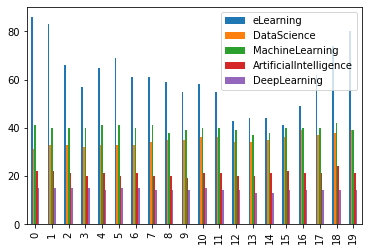
Gráfico de Barras Verticales Apiladas
In [6]:
t_data.plot.bar(stacked=True);
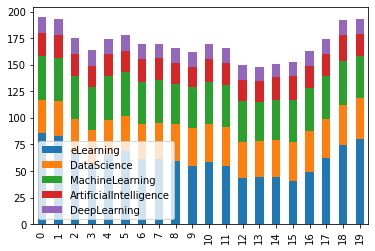
Gráfico de Barras Horizontales Apiladas
In [7]:
t_data.plot.barh(stacked=True);
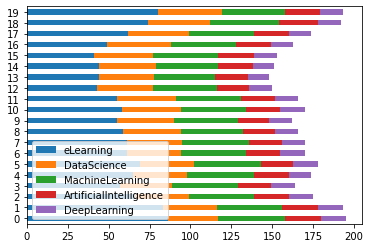
Gráfico de áreas Apiladas
In [8]:
t_data.plot.area();
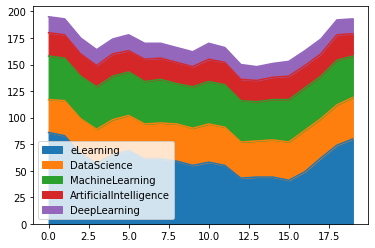
Gráfico de Cajas Vertical
In [9]:
trend_data.plot.box();
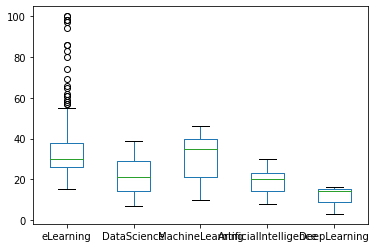
Gráfico de Cajas Horizontales
In [10]:
trend_data.plot.box(vert = False);
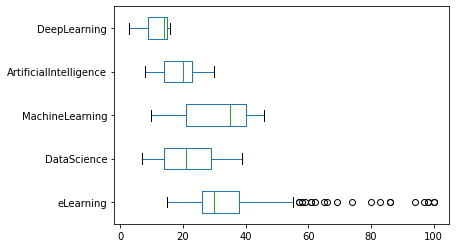
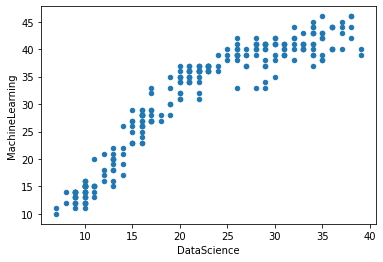
Gráfico de Dispersión
In [11]:
trend_data.plot.scatter(x='DataScience', y='MachineLearning');
- De esta manera se pueden generar rápidamente gráficos directamente desde la librería de Pandas, esperamos que este artículo les haya servido de ayuda.